Current Status
Not Enrolled
Price
R500
Get Started
This course is currently closed
Current Status
Not Enrolled
Price
R500
Get Started
This course is currently closed

Microsoft Excel
What will you learn?
Here are just a few things you’ll be able to do

Learn to create, analyse and visualise data in Excel using charts, graphs and dashboards

How to create a database, analyse for trends and build a stunning dashboard
You'll qualify to write the Microsoft Data Visualisation in Excel exam certification

What We Cover?
- Learn the basic Excel navigation
- Learn how to enter and structure data
- Learn how to style and format your sheet
- Learn how to perform basic calculations on the spreadsheet
- Use some of Excel built in functions
- Create charts and infographics
- Import data from other sources
- Analyze data

Fun Facts:
A dashboard with amazing charts and infographics
20 – 30 Hours
$145,000 per year
Microsoft Excel Associate
**
** External exam voucher fee not included
Make a Dashboard sheet for sales
Course Content
Expand All
Chapter Content
0% Complete
0/3 Steps
Chapter Content
0% Complete
0/7 Steps
Charts V2
5 Topics
|
1 Quiz
Expand
Chapter Content
0% Complete
0/5 Steps
Tables V2
6 Topics
|
1 Quiz
Expand
Chapter Content
0% Complete
0/6 Steps
Manage Data V2
6 Topics
Expand
Chapter Content
0% Complete
0/6 Steps
Data visualisation with Excel
Course Content
Expand All
Chapter Content
0% Complete
0/3 Steps
Chapter Content
0% Complete
0/7 Steps
Charts V2
5 Topics
|
1 Quiz
Expand
Chapter Content
0% Complete
0/5 Steps
Tables V2
6 Topics
|
1 Quiz
Expand
Chapter Content
0% Complete
0/6 Steps
Manage Data V2
6 Topics
Expand
Chapter Content
0% Complete
0/6 Steps

 #WOW – What Outstanding Work – Awards: join us to learn from our students.
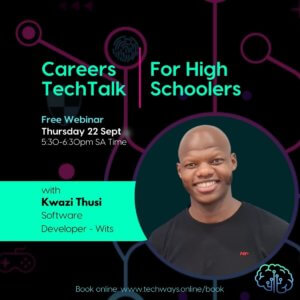
 Calling on all high schoolers interested in tech as a career to join us on 16 September at 5:30pm. If you missed it, we’ll host another one on 18 November.
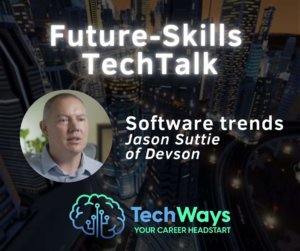 We will be talking to Jason Suttie from Devson. Jason has been in the tech world since he was six years old. He headed IT innovation unit at RMB and has since left to start up his own software consulting company – solving problems and building solutions for clients around the world.