Once you have prepared the data, it is now ready to be used .
However, you need to look at the given questions, or challenges and organize the data in a way that can effectively answer those questions >> this is called Modeling.
The data modeling process often requires the data experts to liaise closely with the business experts, so that the data can answer those business questions.
Data example: this course
For example, let’s say we collect the following data on you in this course:
Your address
Your school
Your test scores
If we want to answer the question: “how well are you doing?” – we would only look at your test scores data and would ignore your school and address.
Data modeling for LM13
You as the expert will need to have a good understanding of the challengesthat LM13 is facing. You need to have a clear set of objectives that can guide you in how you model your data for your specific problem.
LM13 objectives
LM13 were given the following objectives from the Dystopia Government:
To know the citizens’ different factions and those who are unlisted faction
To know the “risky” districts that are more likely to have crime. To help us figure this out, we would collect information like:
The dominant industriesin each district (more jobs >> likely less crime)
The population distribution like gender, age, faction (younger, male >> could mean more crime)
The performance of each district like production revenue, taxes (more taxes >> can pay for police services)
To know the criminal activities in each district
We will come back to these objectives in a later lesson.
Once you have modelled the data, you are now ready for the fun part of the process. Which is data analysis, or as I like to call it, generating information from the data.
Step 3: Visualising the data
Why it is Important
Take the following two examples – which one do you understand better? Why?
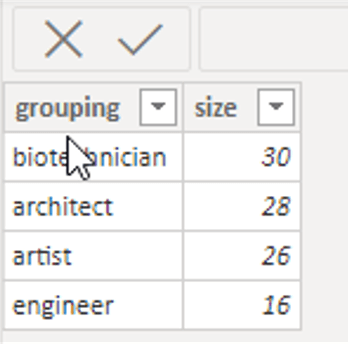
Dataset
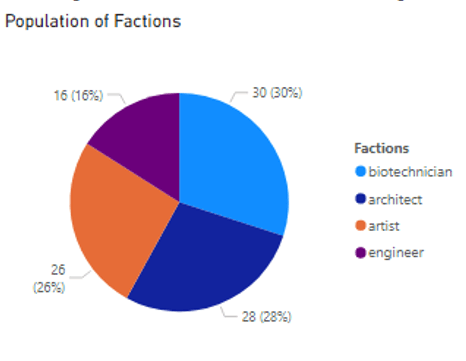
Visualisation of Dataset
Naturally – seeing pictures of the data is easier to understand, remember and communicate. Let’s watch this video for more information on data visualisation.
Next up – let’s learn about our final stage of Data Analysis.